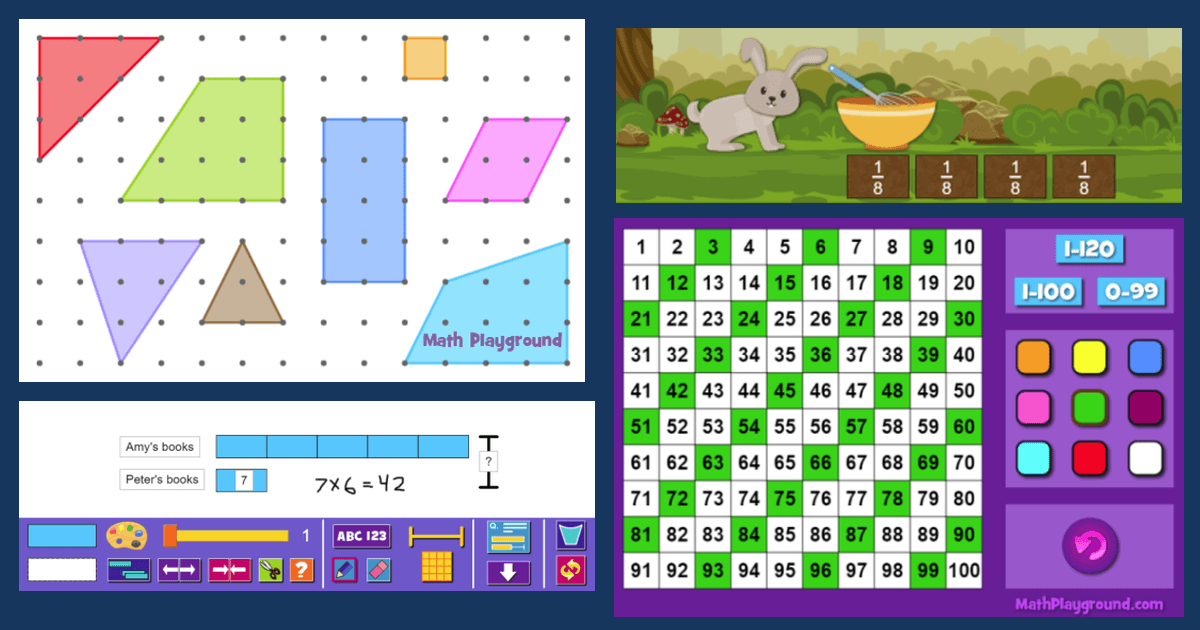
As the saying goes, a picture is worth a thousand words. That is certainly true when teaching math. Visuals not only help us clearly convey concepts; they also measurably improve our students’ math performance1. Powerful learning occurs when we use different areas of our brains at the same time. When we interpret visual information, we engage a different part of the brain than working with numbers. When both parts are active and working together, mathematical learning is enhanced.
Thinking Blocks Modeling Tool
Pictures help students visualize mathematical ideas. They often reveal numerical relationships which can lead to a deeper understanding. Thinking Blocks is a great example of how visuals can help with learning. Students use brightly colored blocks to build models of word problems. In the process, they illustrate important ideas such as comparing quantities and parts of a whole. Students can easily identify known and unknown information and solve multi-step problems.
Teachers can model number relationships for their students with our unique modeling tool. Use blocks, labels, and brackets to illustrate almost any math word problem. Blocks can be resized and partitioned. Equal parts may remain intact or they may be separated. A drawing tool makes it possible to annotate models. One new feature of our modeling tool is the ability to save models. You can now build and save up to eight models. In the classroom, you may select any one of the eight models you saved to show to your students on an interactive whiteboard.
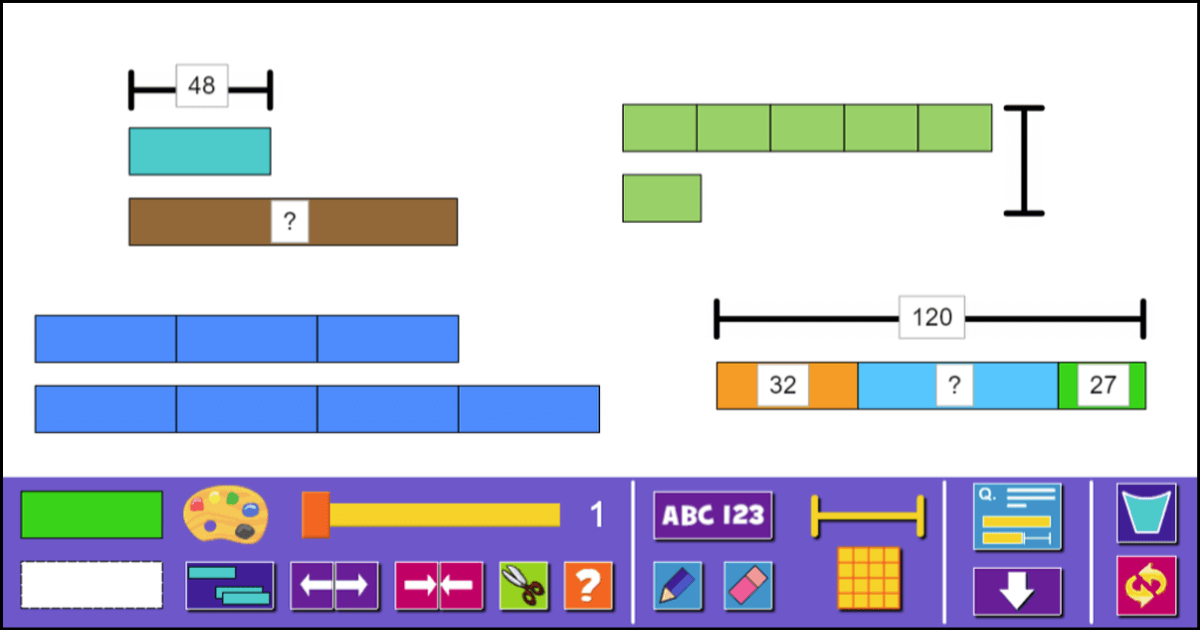
Thinking Blocks modeling tool
Multiplication Charts
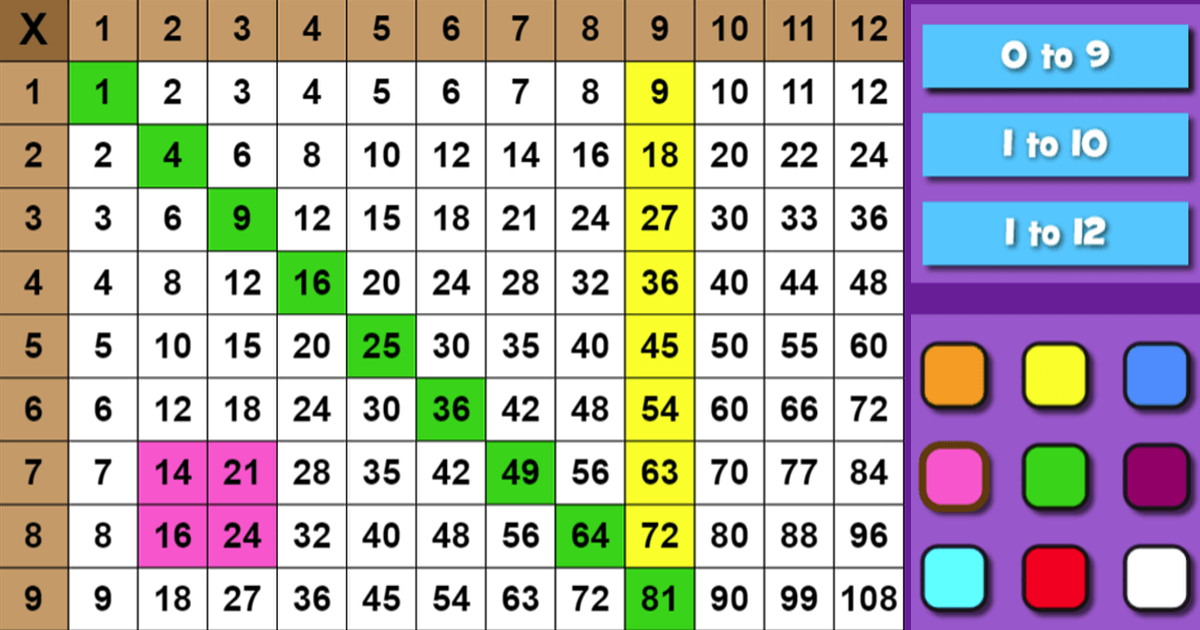
Whether you’re teaching 3rd grade math this year, reviewing math facts with 4th grade students, or introducing 1st and 2nd graders to skip counting, multiplication charts are a valuable classroom tool. Multiplication charts are an effective way to visualize number patterns. You can identify common multiples and draw attention to square numbers. The commutative property of multiplication comes alive within the symmetry of the chart.
Use our interactive multiplication chart the next time you teach this topic. Choose among three number ranges and use the paint tool to illustrate patterns and relationships. Highlight an entire row, column, or diagonal. Extend your multiplication lesson with the Treasure Quest game where students are asked to place numbers on a blank multiplication chart.
multiplication chart
Hundreds Chart
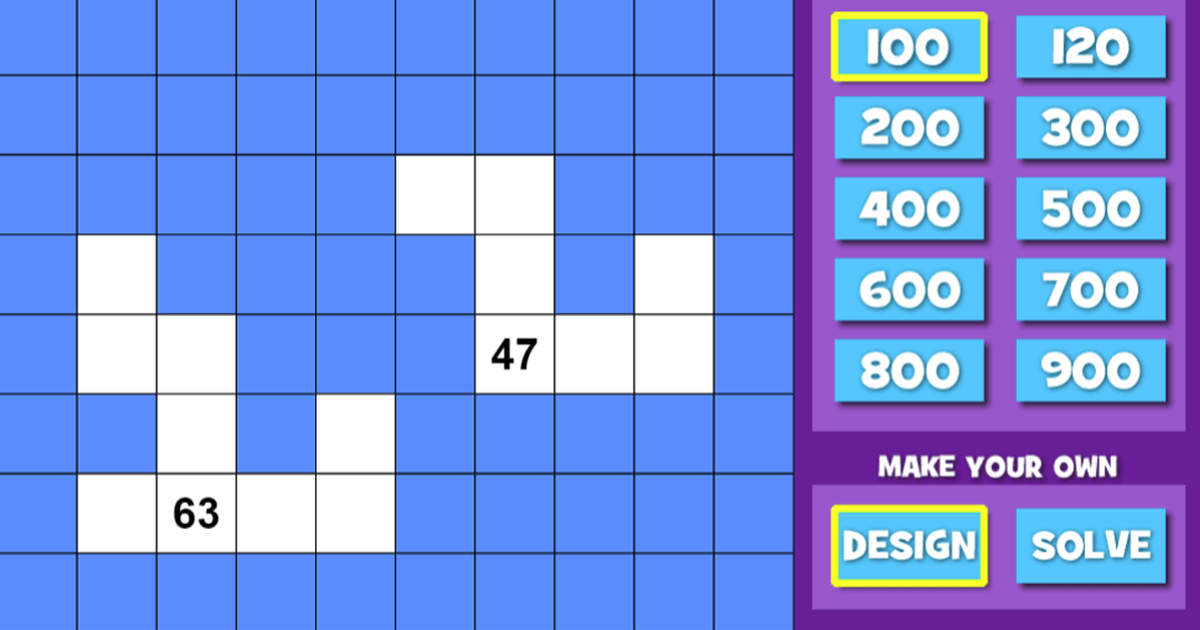
Our interactive hundreds chart is a must-have tool for K-3 teachers. You can set the number range through 99, 100 or 120 and use the paint tool to highlight patterns. That’s all you need to begin your investigation of place value, multiples, addition, subtraction, and number patterns.
Another very effective use of the hundreds chart is to eliminate all but one number. The challenge is to identify the neighboring numbers. This is a powerful way to practice adding and subtracting ones and tens. Math Playground has an interactive tool that allows you to create your own hundreds chart puzzles! Choose number ranges through 900 and design a pattern puzzle for your students to solve. You may also use one of our pre-built patterns to introduce the lesson. Follow up with Treasure Quest Hundreds Chart, an interactive game your students can play online.
For upper elementary teachers, we also have a decimal version of each activity. Students can explore tenths and hundredths visually.
interactive hundreds chart
Pattern Blocks
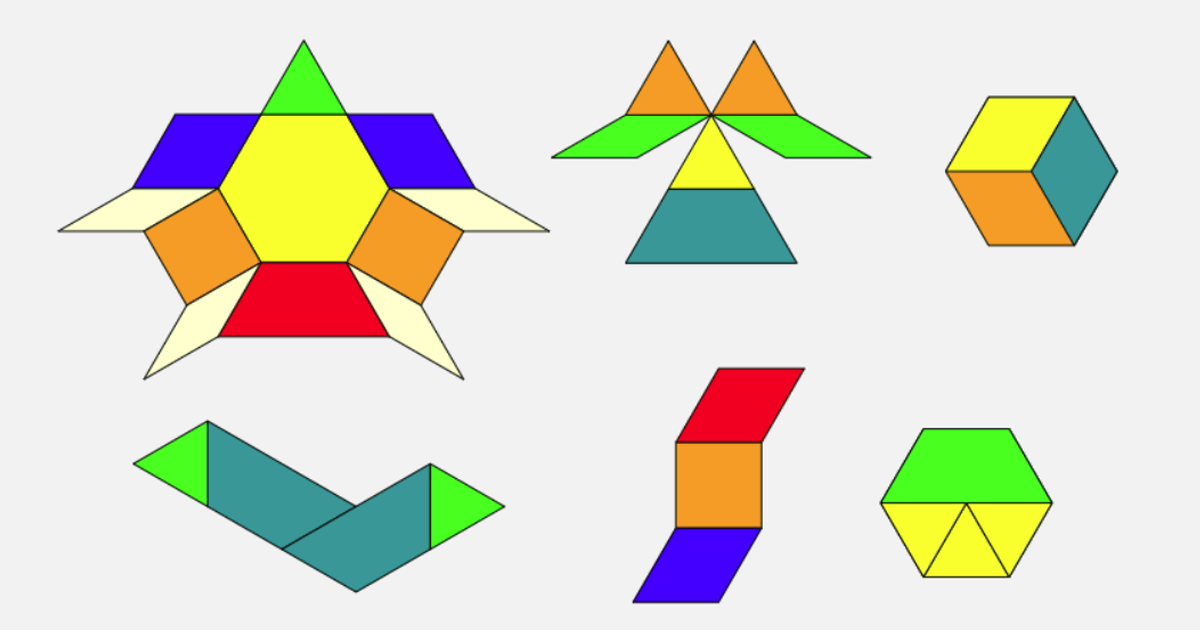
Pattern blocks are a highly versatile math manipulative. Our online pattern blocks can be used to illustrate symmetry, rotation, geometric relationships, and fractions. What better way to engage students than unstructured free-play with colorful shapes? Once students have had time to investigate patterns and discover relationships, you can then focus their attention on specific learning tasks.
pattern blocks

